Post #4 Forecast vs. Reality — The First Paycheck Stress Test
Every system sounds good in theory. The real test is how it performs.
🔨 Builder’s Note (Top)
To be perfectly honest, I didn’t expect that starting a blog (even with AI support) would take this much work. So, apologies for the delay in getting this post out. The goal of this forecast was to put Plan B to the test and see how it would hold up against reality. Overall, we did well. But the real question is: how well? Below is the AI‑generated summary of our first stress test.
📊 Forecast vs. Reality Table
| Category | Result |
|---|---|
| Mortgage | ✅ On target |
| House Alarm | ✅ On target |
| TW Student Loan | ✅ On target |
| Car Insurance | ✅ On target |
| Jet Ski Insurance | ✅ On target |
| Utilities | ✅ On target |
| Debt Payments | ✅ On target |
| Groceries & Household | Spent $82.38 more than expected |
| Gasoline | Spent $41.07 more than expected |
| Discretionary (incl. Emotional) | Spent $58.03 more than expected |
| Household Online | Spent $11.11 more than expected |
| Savings | Saved $408.75 more than expected |
| Unexpected Deposits | Received $39.74 more than expected |
📈 Forecast vs. Reality Chart
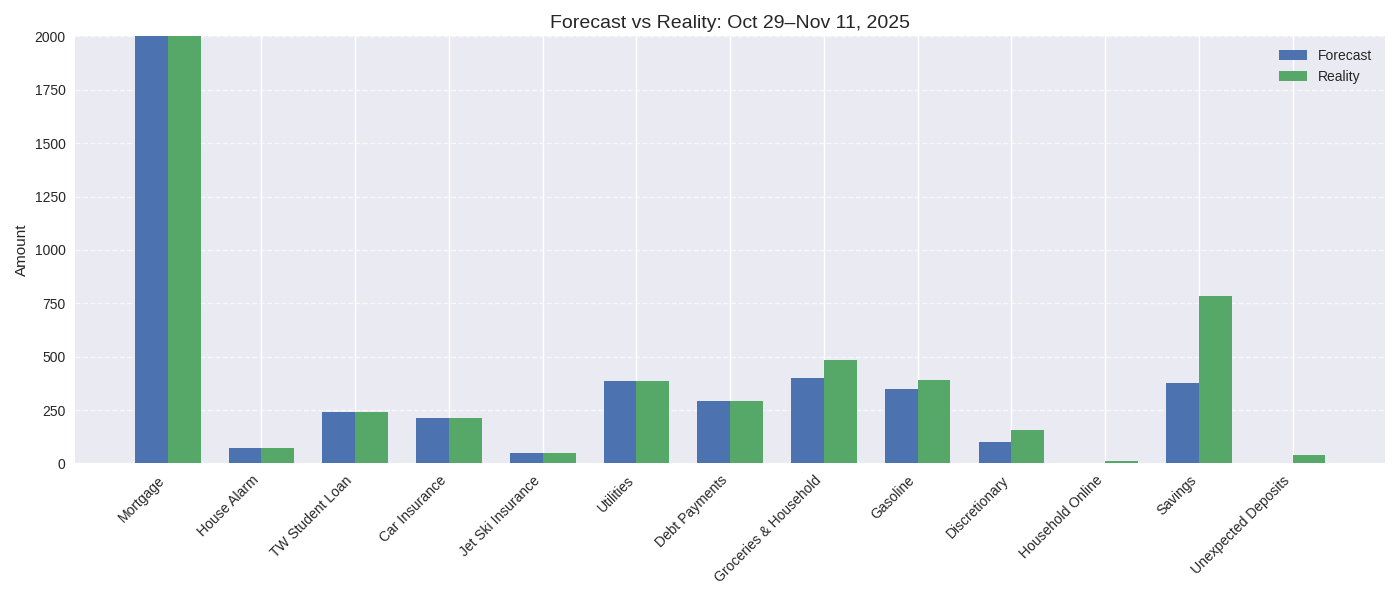
This full chart shows every category side by side — forecast vs. reality — across the first paycheck cycle. It’s the big-picture view of how Plan B held up under real-life conditions.
📉 Zoomed-In Variance Char
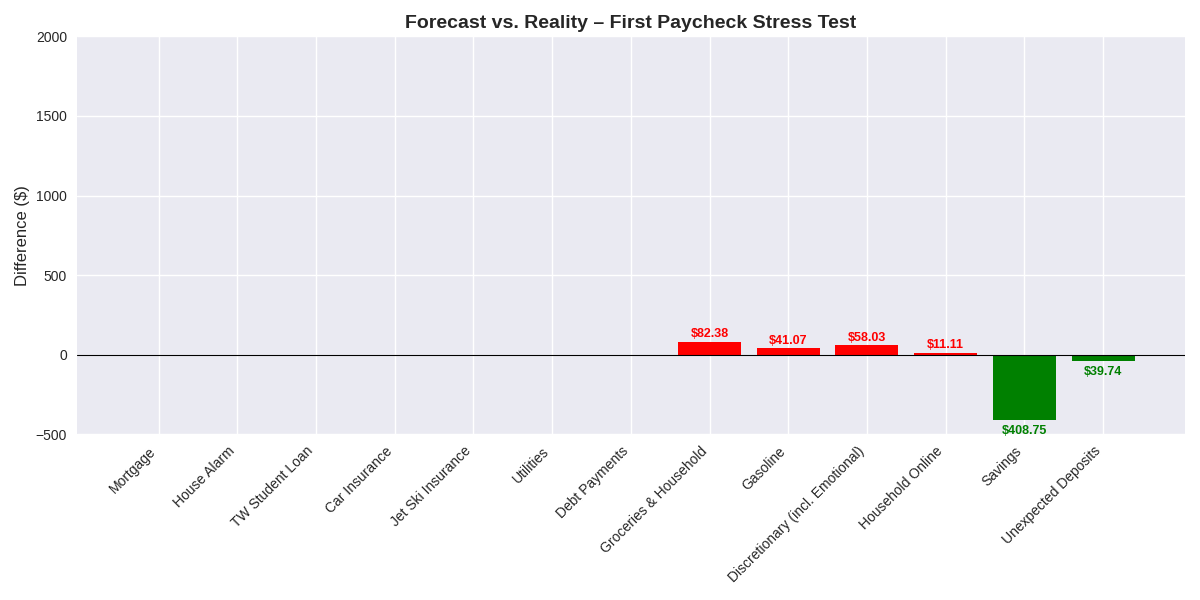
This chart focuses only on the categories that moved — the ones that went over, saved more, or showed up unexpectedly. It strips out the noise and zeroes in on the real action:
- Groceries & Household ran $82.38 higher than forecast.
- Gasoline came in $41.07 over.
- Discretionary (including emotional spending) exceeded forecast by $58.03, driven by kids’ clothing, a digital game, and Kaiser copays.
- Household Online added an unexpected $11.11 purchase.
- Unexpected Deposits brought in $39.74 we didn’t plan for.
- Savings outperformed by $408.75 — nearly double the forecast.
Together, these categories tell the story of how Plan B absorbed real-life surprises while still delivering control. This zoomed-in view makes it easy to spot the pressure points and the wins.
🔎 Analysis
- Mortgage, insurance, utilities, and debt payments all landed exactly on target.
- Groceries ran $82.38 higher than expected.
- Gasoline came in $41.07 higher than expected.
- Discretionary/Emotional spending exceeded forecast by $58.03, driven by kids’ clothing, digital game, and medical copays.
- Household Online added an unexpected $11.11 purchase.
- Savings outperformed by $408.75, showing the system flexed upward.
- Unexpected deposits of $39.74 provided a small bonus not forecasted.
🧭 Strategy Connection
This stress test shows Plan B is aligned with the Optimized Cash Flow Strategy:
- Capital One is paid off (still open for ballet autopay).
- Student loans resumed on schedule.
- Tuition Buffer is already ahead of pace.
- Rainy Day deposits continue, even at reduced levels.
- Debt pacing (Home Depot, Yamaha, Mortgage) remains intact.
🔨 Builder’s Note (Bottom)
As expected, all our routine bills and loans were paid on time — no surprises there. We did go over budget on groceries and gas, but not by much. Discretionary, emotional, and unexpected spending categories will always be a challenge (for everyone, LOL), so I was glad to see the overage wasn’t excessive. My son broke his arm, which brought some unplanned copays into the mix.
While we are technically over budget for this cycle, Plan B is designed to measure the entire month before calling the final outcome. So, we don’t have the full picture just yet.
The next post will cover the entire month of October 2025, and I plan to add a dashboard or two as I continue learning how to blog. If you have any questions, feel free to send me a ping.
Teaser for Post #5: This will be the first time we zoom out to the whole month view. Expect dashboards that show categories side‑by‑side, a surplus tracker, and a clear picture of how Plan B balances wins and overages across the entire cycle.